Utah real estate market forecast 2026: Home prices and sales

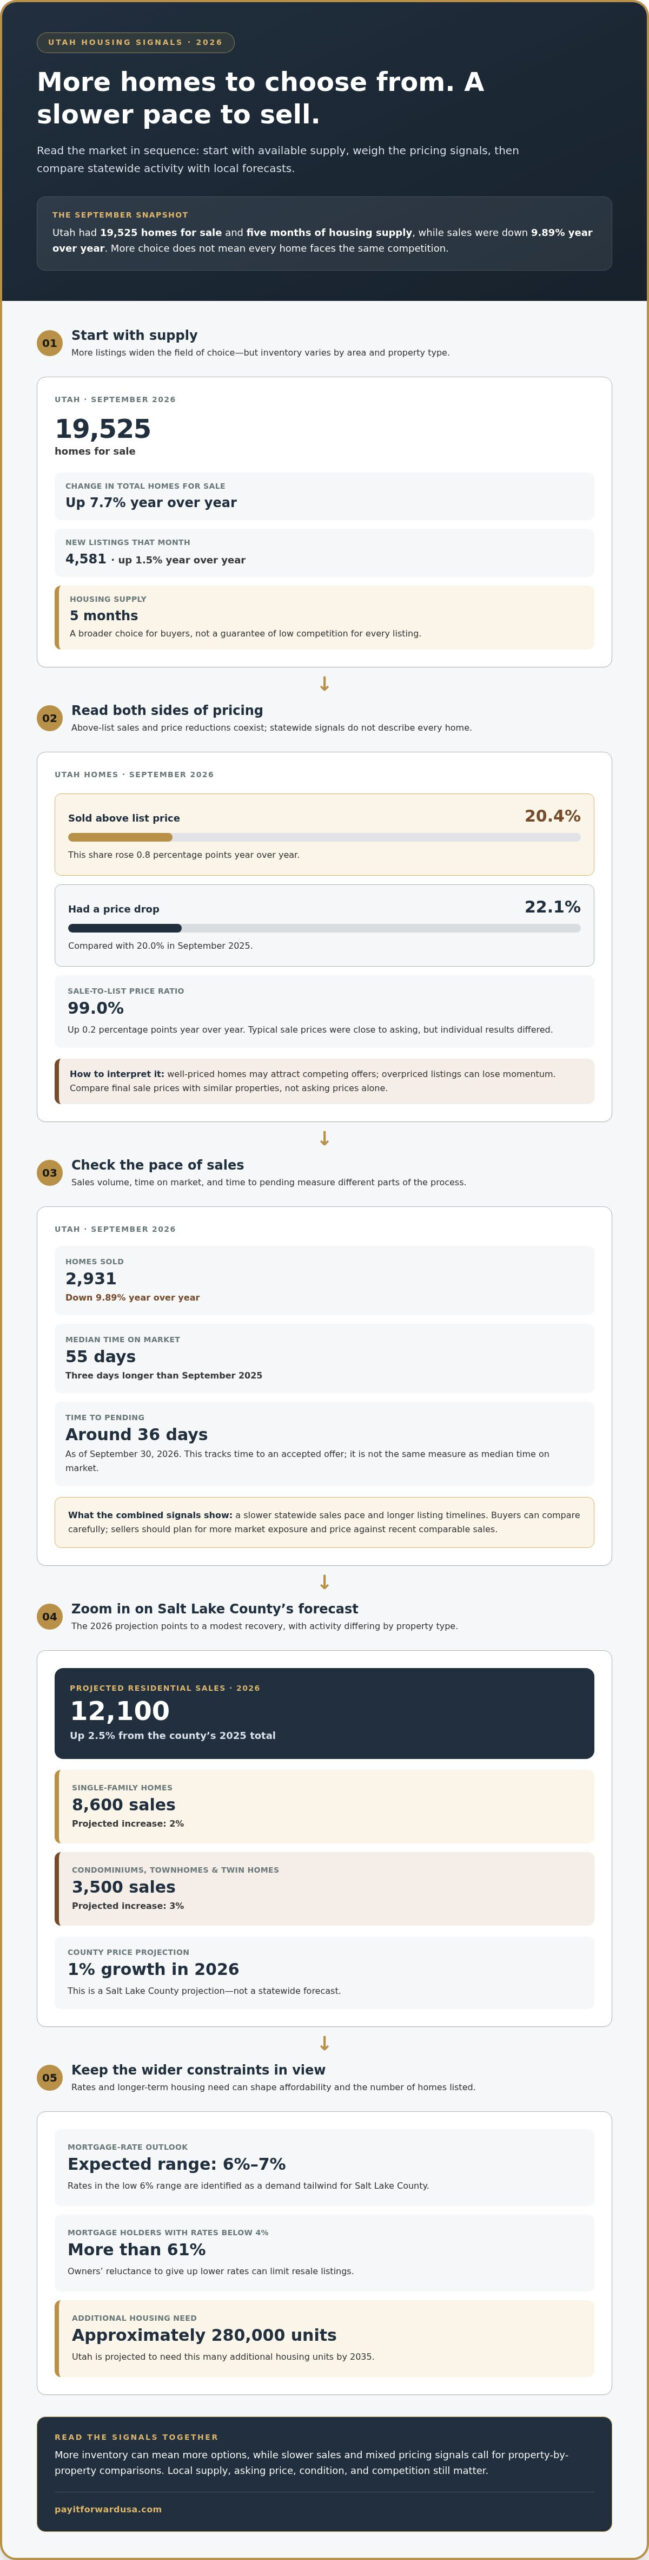
More homes are available in Utah, but buyers aren’t snapping them up as quickly. The utah real estate market forecast 2026 points to a more measured pace: September brought 19,525 homes for sale and five months of housing supply, while sales fell 9.89% year over year. That gives buyers more room to compare options, though desirable homes can still draw strong offers.
It’s reasonable to wonder whether supply is finally catching up with demand. The numbers show a market with more choice and longer selling timelines, not a guarantee that every buyer will find the right home or every seller will get a quick offer.
Here, you’ll see how inventory, sales, days on market, and above-list offers fit together, and what those trends may mean for Utah buyers and sellers in 2026. We’ll focus on the local signals that matter most, so you can read the market clearly and plan your next move with confidence.
Key Takeaways
- Compare above-list sales with price reductions: in September, 20.4% of Utah homes sold above list while 22.1% had price drops. These contrasting signals show why buyers and sellers should assess each property, not just the statewide mood.
- Allow for a longer selling timeline: Utah’s median time on market reached 55 days in September. Sellers can use this pace to set realistic expectations and plan their next move.
- Expect sales activity to vary by property type and location. Salt Lake County’s 2026 forecast calls for 12,100 residential sales, with separate projections for single-family homes and attached properties.
- Put affordability into your decision: compare the full monthly cost of owning with your budget, then weigh how a home’s price, condition, and competition affect your offer strategy.
Homes sold above list price
In September 2026, 20.4% of Utah homes sold above list. That share rose 0.8 percentage points year over year. Competition remains, but the figure doesn’t describe every listing. Salt Lake County is projected to see 1% home price growth in 2026. Local results still depend on supply, asking prices, and buyer demand.
In September 2026, Utah’s sale-to-list price ratio was 99.0%. It rose 0.2 percentage points year over year. Typical sale prices were close to asking, but not every home sold at list. Well-priced homes may attract competing offers; overpriced listings can lose momentum. Compare final sale prices with similar properties, not asking prices alone.
That was 2.2% higher than a year earlier. Separately, Utah’s average home value was $532,920 on September 30, 2026. That value was up 1.2% over the past year. An average value estimate differs from a median of completed sales.
Price reductions offer a counterweight to rising prices. In September 2026, 22.1% of Utah homes had price drops. That compared with 20.0% in September 2025. Buyers can look for listings where seller expectations have adjusted, even as select homes draw bids. Review recent comparable sales and active competition before setting an asking price or offer. Treat a price cut as a negotiation opening, then evaluate the home’s condition and comparable sales. Statewide trends provide context, but pricing decisions work best when tied to the property and its local competition.
What is the housing market like right now?
Utah’s 2026 outlook combines more listings with long-term demand for housing. The state is projected to need approximately 280,000 additional housing units by 2035. In September 2026, buyers could choose from 19,525 homes for sale, up 7.7% year over year. Five months of housing supply gives buyers more options than a tighter market, but it doesn’t mean every home faces the same level of competition. Compare inventory and pricing in the specific area and property type you’re considering.
How does Utah’s 2026 housing outlook compare with the national forecast? Salt Lake County home prices are projected to increase by 1% in 2026, a modest local benchmark. A meaningful national comparison requires looking at the same measure and period; a county projection should not be treated as Utah’s statewide forecast.
How are Utah rents and the rental market forecast to change in 2026? Asking rents for single-family detached homes increased by 8.5%, and townhome rents by 8.3%, from March 2024 to March 2026. Apartment asking prices moved the other way, declining by 2.3% over that period. These different trends show why renters should compare housing type and location, rather than assume one statewide rent pattern.
How are Utah mortgage rates expected to affect the 2026 housing market? Rates are expected to fluctuate within a 6%-7% range, while rates in the low 6% range are identified as a demand tailwind for Salt Lake County. At the same time, more than 61% of mortgage holders have rates below 4%, which can limit resale listings as owners hesitate to move.
What risks could change Utah’s 2026 outlook? Mortgage-rate shifts can alter affordability and buyer demand, while owners’ reluctance to sell can constrain available homes. Track active inventory and local pricing together: September’s five months of supply and 7.7% annual inventory increase offer useful context, but conditions can differ by market segment.
Home sales and days on market
Utah recorded 2,931 home sales in September 2026, down 9.89% year over year. The median time on market was 55 days, three days longer than September 2025. Together, these figures show a slower statewide sales pace. Buyers can use the longer timeline to compare homes carefully. Sellers should plan for more market exposure and set asking prices with recent comparable sales in view.
Homes in Utah went pending in around 36 days as of September 30, 2026. That measure differs from the 55-day median time on market. Pending time tracks how long homes take to reach an accepted offer, while market-time figures can reflect a broader listing period. Use each measure for its specific purpose: pending pace helps assess offer activity, and days on market helps evaluate listing duration.
Salt Lake County recorded 11,797 residential sales in 2025, down 2.4% from 2024’s 12,090 sales. Its median days on market rose to 36 in 2025. The county also recorded 9.5 residential sales per 1,000 people, below its 25-year average of 13.7. That gap signals sales activity below its longer-run pace, even as individual neighborhoods and property types can move differently.
The 2026 Salt Lake County forecast calls for 12,100 residential sales, a 2.5% increase. Single-family sales are projected at 8,600, up 2%, while condominium, townhome, and twin-home sales are forecast at 3,500, up 3%. These projections suggest a modest recovery, not a uniform surge. Buyers can compare activity by property type before setting their search pace. Sellers can use local pending activity, competing listings, and recent closed sales to judge whether their home’s likely timeline matches their plans. A property that attracts little attention may need a sharper price or presentation strategy.
What is Utah’s 2026 housing inventory and sales forecast?
Utah’s September listing figures show fresh supply entering the market, but not at the same pace as total inventory growth. The state recorded 4,581 newly listed homes that month, up 1.5% year over year. Total homes for sale reached 19,525, an annual increase of 7.7%. New listings add choice; existing unsold listings also contribute to the inventory available to buyers.
That distinction matters for interpreting the 2026 outlook. More active listings give buyers additional options, while the flow of new listings shows how quickly sellers are adding competition. Five months of housing supply in September offers a snapshot of the balance between listings and sales. Buyers can compare similar homes currently for sale, while sellers can assess competing listings before setting an asking price.
Salt Lake County’s 2026 forecast projects 12,100 residential sales, up 2.5%. The projection includes 8,600 single-family sales, up 2%, and 3,500 condominium, townhome, and twin-home sales, up 3%. Those figures indicate forecast growth across both detached and attached housing. They also show why buyers and sellers should examine the relevant property type instead of treating the county as one uniform market.
Inventory conditions will depend on how new listings, sales, and mortgage-rate decisions interact. More than 61% of mortgage holders have rates below 4%, creating an interest-rate-lock headwind in Salt Lake County. Owners who stay put don’t add resale listings; buyers still compete for the homes that do come up. Track active listings and new arrivals in your target area, then compare them with recent sales. For a sale in this changing inventory environment, review your Utah listing options and choose an approach that fits your plans.
Pay It Forward Realty: Listing and Buyer Options
Pay It Forward Realty LLC helps Utah homeowners who want to sell themselves while still getting MLS exposure. Sellers can choose a flat-fee listing package, with options for different levels of support. Utah buyers may also qualify for a rebate through the brokerage.
A slower sales pace or more competing listings can make a clear selling plan especially useful. Compare your timeline and desired level of support when choosing a listing package. Buyers can include a potential rebate in their purchase planning.
Explore the option that fits your move, then visit Pay It Forward Realty LLC to learn more.
Make your next move with a clear plan
The Utah real estate market forecast for 2026 is useful context, but your next move should reflect your own timeline, budget, and priorities. Buyers can define their must-haves before touring, then compare each home’s condition and competing listings before making an offer. Sellers can prepare a pricing and negotiation plan around their goals, including how they’ll respond to buyer feedback.
Keep the decision practical. Choose neighborhoods that fit your daily life, organize the documents you’ll need, and set a comfortable financial limit before negotiations begin. A clear plan helps you make decisions without treating broad market trends as a substitute for evaluating a specific property.
If you’re preparing to buy or sell in Utah, contact Pay It Forward Realty LLC to explore a next step that fits your plans. Take the time to choose confidently and move forward on your terms.
Frequently Asked Questions
Are there enough homes for sale to meet buyer demand?
More listings do not necessarily mean the right home is available. Inventory can look adequate overall while remaining tight in a particular price range, home style, or neighborhood. Define your search area and must-haves, then compare active listings with recent sales in that segment. This helps show whether you have real alternatives or may need to move promptly on a suitable home.
How competitive is the market?
Competition depends on the property, not just statewide conditions. A well-priced home that meets local demand can attract strong interest, while one priced above comparable homes may take longer to sell or need a price reduction. Buyers should review comparable sales and the property’s condition before deciding what to offer. Sellers can use competing listings and buyer feedback to reassess their price and terms.
Where are people moving to and from?
Between April and June 2026, 19% of U.S. homebuyers searched to move to a different metro area. That national figure reflects interest in relocation, not a specific flow into or out of Utah. For a Utah move, compare practical trade-offs between places such as Salt Lake and Provo, including commute patterns, housing choices, and proximity to work or family.
Why Buy Now?
Buying now can make sense if a home fits your needs, financing, and timeline. Set a comfortable monthly budget, then compare the full cost of owning with renting and the cost of waiting. Review the property’s condition, location, and comparable sales before making an offer. A clear decision framework helps you act on a suitable home without relying on predictions alone.
What is Utah’s 2026 home price forecast?
The Utah real estate market forecast for 2026 points to measured growth, with substantial differences by location and property type. Treat statewide trends as context, then evaluate comparable homes in the neighborhood you’re considering. Buyers can use that comparison to judge value and shape an offer. Sellers can use it to set an asking price that reflects current competition and buyer choices.
What are the 2026 housing market forecasts for Salt Lake City and Provo?
The 2026 price projection is for Salt Lake County, not Salt Lake City alone: county home prices are projected to increase by 1%. Use that as a regional reference, not a city-level guarantee. For Provo, evaluate local listings and comparable sales directly. Differences in housing mix, available inventory, and buyer demand can make conditions distinct between these Utah markets.